


What a year it has been (for better or for worse.) If this year has proven anything, it is that the private markets are now more important than ever. This year we saw massive changes in the online private markets — from more secondary platforms opening up to the SEC updating Regulation CF raise limits. And like any industry, COVID-19 undoubtedly had an impact.
We hope you and your loved ones are staying safe and healthy. With that, we wanted to take some time to look back on this year. For those of you that have been with us for some time, you were probably just as excited as we were for the launch of our start-up ratings and analytics platform, Merlin. With Merlin, we continue to be leaders in the space and offer the most comprehensive coverage of the online private markets.
But now for the fun stuff.
We collected data on all of the 2020 equity deals (and our ratings for them) and wanted to bring you some year-end statistics.
Where the Deals Came From
First, let’s check out where these deals came from. Below is a map of where all the 2020 equity deals were sourced from across the country.
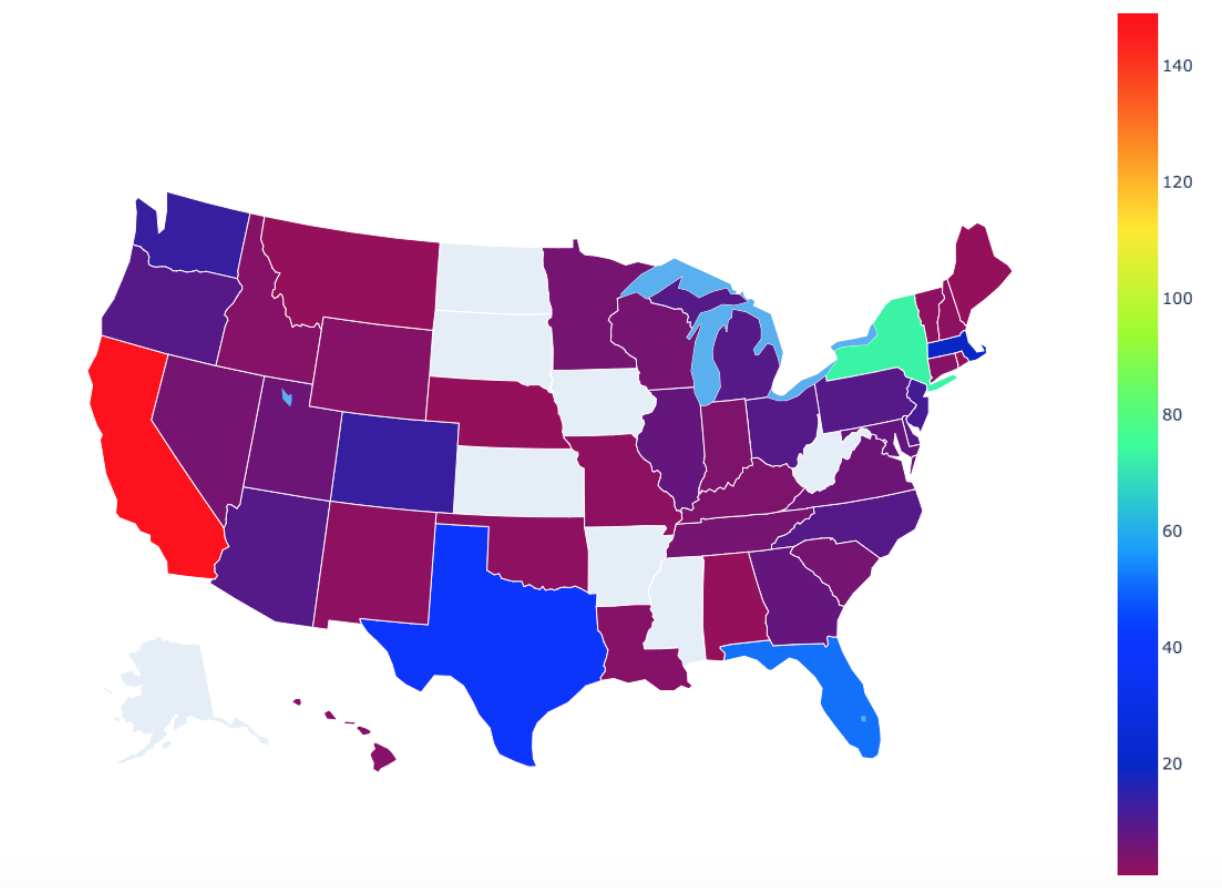
We were thrilled to see the wide geographical distribution of the 2020 equity deals. As expected, California, New York, Florida, and Texas led the country in online equity deal flow, but this year 45 states and territories were represented in all (including DC and Puerto Rico).
How We Rated the Deals
At KingsCrowd, we split our coverage into four buckets: Underweights, Neutral Deals, Deals to Watch, and Top Deals. Underweights are deals that we feel would not make great returns on investment, likely for several reasons. Neutral Deals are those that may have some upside but definitely come with significant risk too. Deals to Watch impressed our investment staff in more than one ratings category — whether that be price, market, team, business model, or competitive differentiation. Finally, Top Deals are those that scored well across the board, and we believe are poised for high returns on investment.
So you might be wondering, of all the deals we saw in 2020, what was the breakdown of the KingsCrowd coverage?

As expected, this year we were very selective with our Top Deals. As always, we want to make sure that the deals we highlight are poised for maximum return on investment. The Neutral Deal category was also introduced midway through 2020, limiting its representation for the year. Overall, Deal to Watch was the most populated category for 2020.
Let’s break this down even further. Check out just the deals we covered by security type, as well as the security type across all the 2020 deal flow (which includes deals that did not receive coverage).
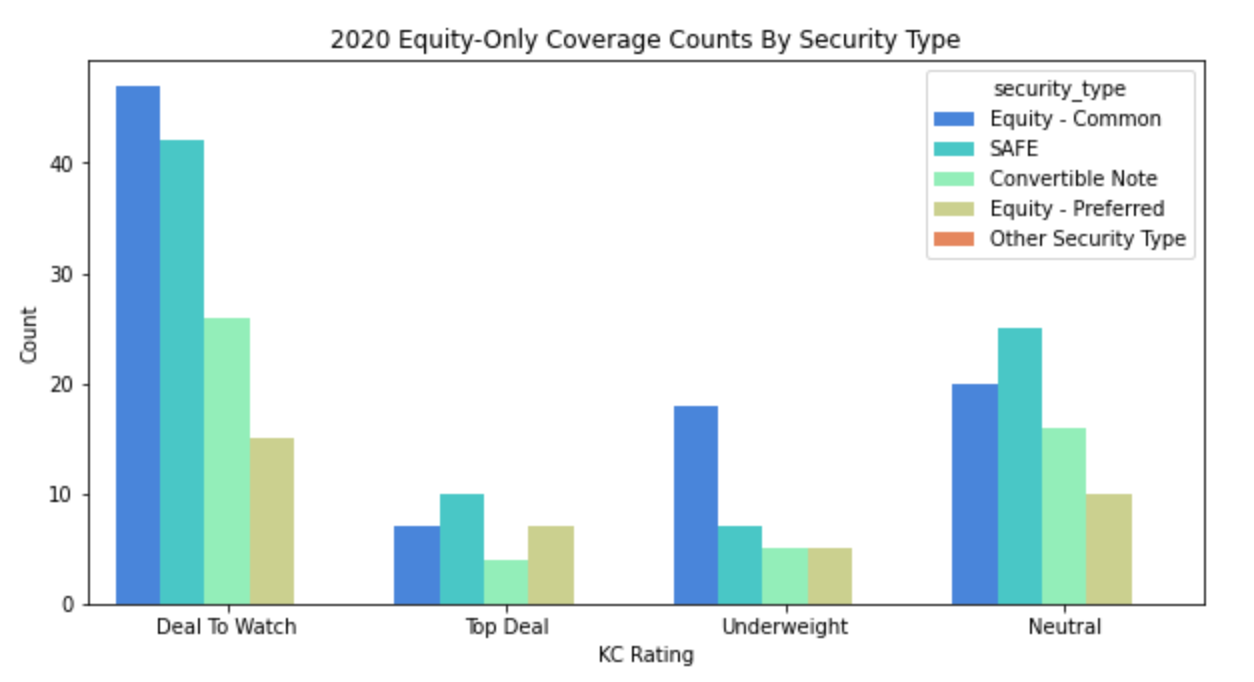

As you can see, common equity and SAFEs have solid representation in the Deal to Watch and Top Deal categories. However, it should be noted that these security types are also the most popular in general.
You may have also noticed that “Business Type” is one of the attributes that we look at when collecting data for our rating algorithm (check out the ratings breakdown for the Market metric if you have no idea what I’m talking about). We have three subcategories of business type — high growth, growth, and lifestyle.
High growth business types are those that we believe have the potential to be a unicorn in their respective markets. These currently comprise 21% of all active companies in our database (2020 campaigns and prior raises that remain live). Growth companies have the potential for robust and rapid growth — but will likely not reach unicorn status. These companies make up 56% of the total active deal flow. Finally, lifestyle businesses are focused on profitability and have much less emphasis on rapid growth. Here you can see this more subjective metric and how it compares to our coverage categories, as well as the distribution across all equity deal flow.


When the Deals Happened
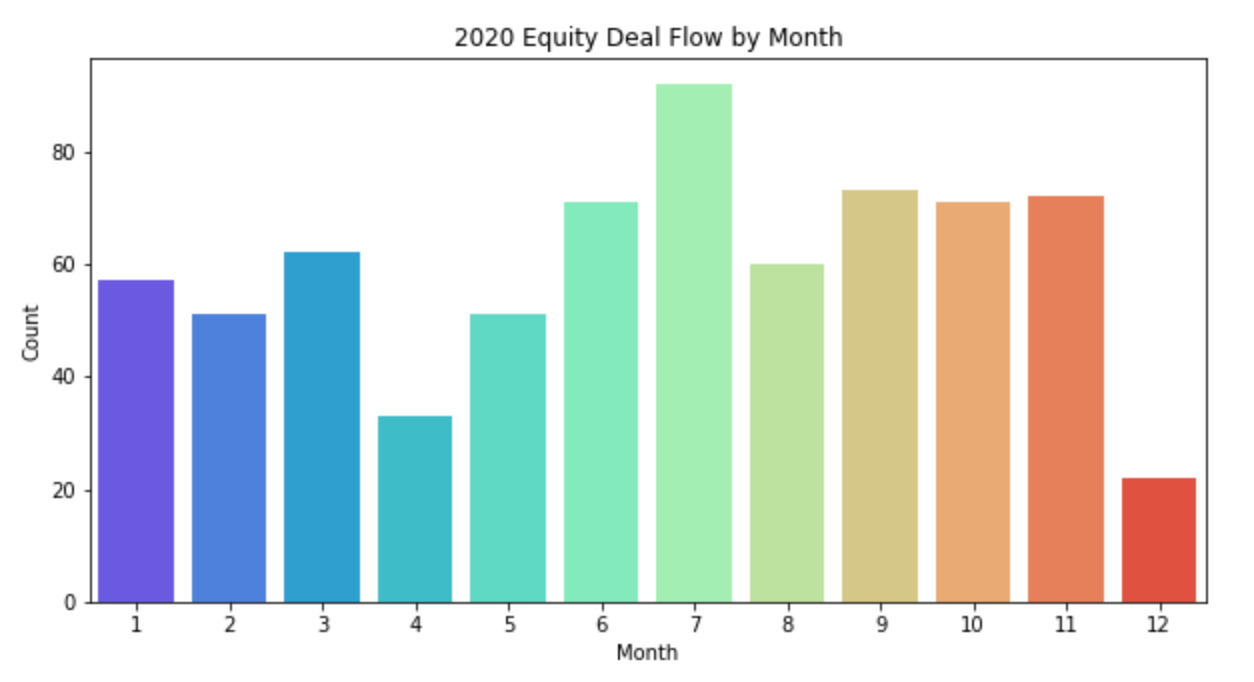
Now, if you were to guess what month of 2020 was the busiest for equity deals, what would it be? If you said July, nice work!
We saw quite a bit more deal flow in July compared to the rest of 2020. But keep in mind, the year isn’t over yet (hence the December dropoff)… Though it seems the online private markets tend to favor the warmer months.
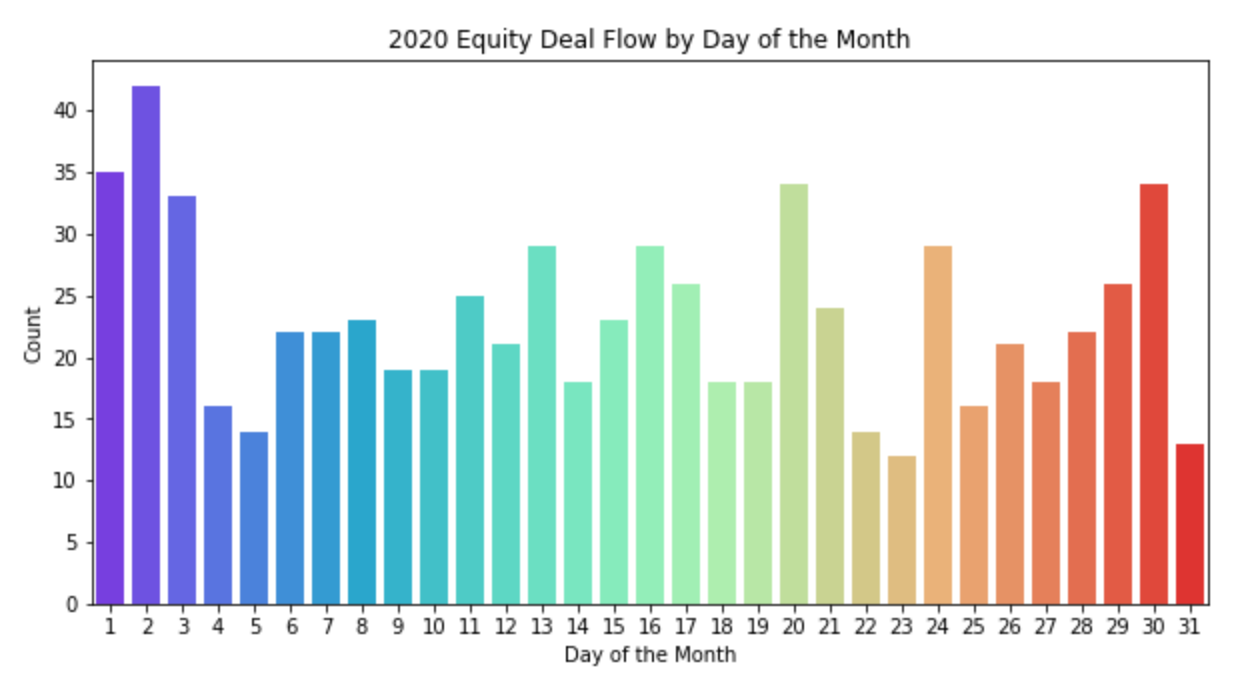
Curious as to the days of the month that equity crowdfunding sees the most deal flow? Check our breakdown of deal flow across all of 2020 by day.
2020 vs 2019
According to our data, 455 raises successfully closed in 2020 — up more than 40% from 323 raises in 2019. To date, over $186 million was raised in 2020 via the online private markets. That’s a huge increase of 78% from 2019. We expect this explosive growth to continue into 2021 and beyond, and we will continue to be there every step of the way offering comprehensive coverage of the markets. For more industry-wide analytics, be sure to check out our analytics page now in beta!
We hope this data gets you excited for the year to come. Here’s to another year of democratizing access to startup investing and continuing to make educated investment decisions in the startup space.
Happy New Year from the KingsCrowd team! We can’t wait to see what 2021 has in store.


